Recent works


The problems are solved, not by giving new information, but by arranging what we have known since long.
- Ludwig WittgensteinWhat if your data visualization is inefficient?
The ability to transform raw data into actionable information requires visualising the data in proper and structured manner.
What is Cartoskill all about?
Cartoskill is a key to visually explore, analyse and understand the multifaceted cause of a particular phenomenon and their correlation. I dish them out effectively and accurately through visuals that are aesthetically appealing, as well as easily perceivable.
How can I help?
The eclectic craft of data visualization embraces several traditionally discrete subjects like cognitive science, graphic design, cartography, and computer science. I use this multidisciplinary recipe to visually communicate various real world phenomena occurring in all walks of life around us as filtered through my analytical thinking.
Featured Works

Analytical Visualisation
Analysing global military spending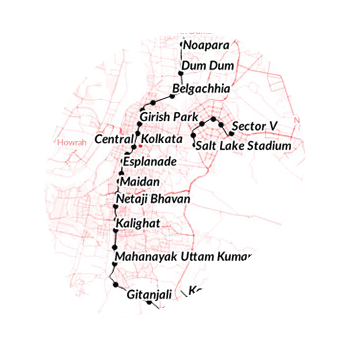
Flow maps
Rapid transit networks in India
Bivartiate map
Does high GDP imply higher CO2 emission?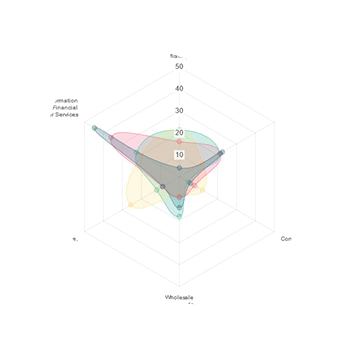
Visual interpretation
Changing shape of economy over the years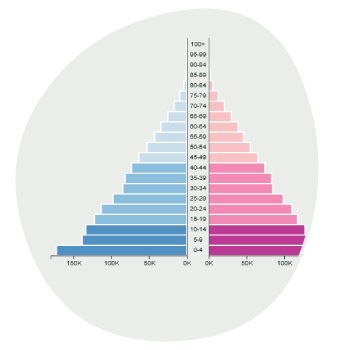
Population Pyramids
Age distribution in G-20 countries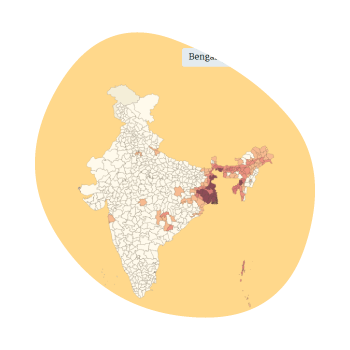
Unity in diversity
Linguistic diversity of India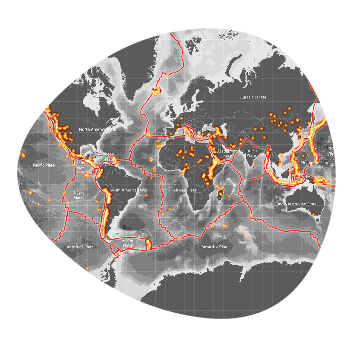
Ring of fire
World distribution of volcanoes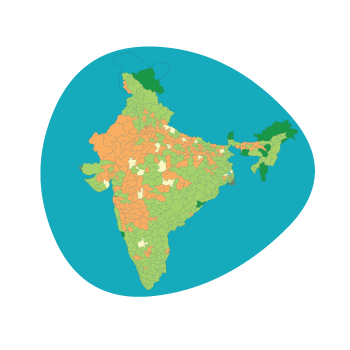
Election statistics
Analysing voting power in India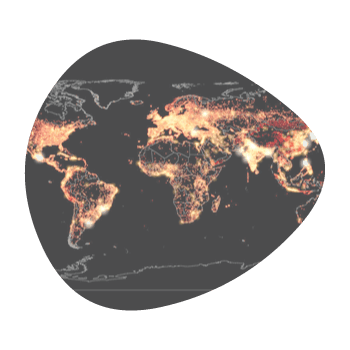
Art of Cartography
World urban agglomerationsSelect region
Select year
Access to electricity
Access to clean fuels and technologies for cooking
People using at least basic sanitation services
People using at least basic drinking water services
Individuals using the Internet

I am
Arunava Dey
from Kolkata, India
Education
- Master of Technology in Geomatics from Indian Institute of Surveying & Mapping, Hyderabad (2009)
- Master of Arts in Geography from Pune University, Pune (2007)
- Bachelor of Arts in Geography from Banaras Hindu University, Varanasi (2005)
Experience
I have more than 15 years of experience in data analysis, cartography, and GIS in both private & public sector. Currently, I am working as Research Officer at NITI Aayog, Government of India (the erstwhile Planning Commission).
I have worked in various Government of India flagship central schemes including SMART city, AMRUT. and etc. Currently I am working on upgradation of NGO Darpan, a Government of India portal for NGOs.

my skillset
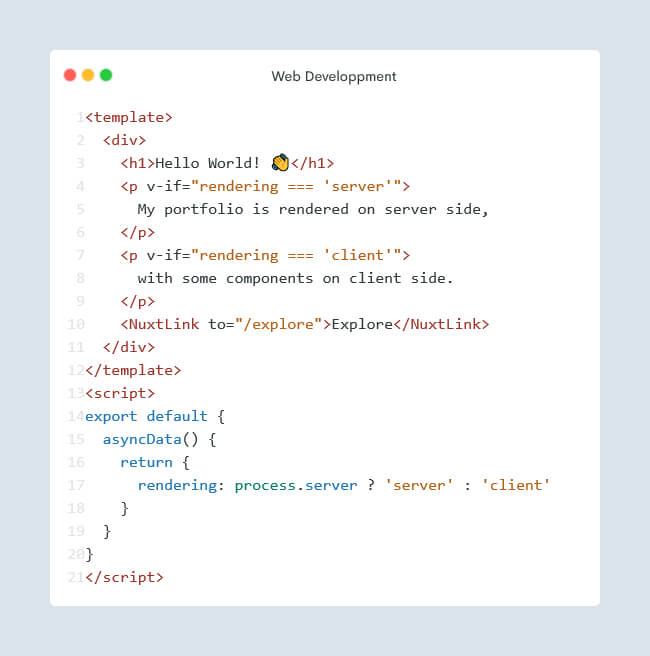
web design & development
Vue.js, Nuxt.js, D3.js, Chart.js, PostgreSQL, Photoshop, Illustrator
GIS &
cartography
ArcGIS, QGIS, GeoServer, PostGIS, Leaflet, Open Layers
Play
Check your Geo-knowledge

Disclaimer:
This is my personal blog. Any views or opinions represented here are personal and do not represent those of people, institutions, or organisations that I may or may not be associated with in a professional or personal capacity.
Cartoskill
A cartographer’s portfolio for spatial data visualisation