Third dimension in cartography
3D mapping supplements spatial analysis and enhances visualisations by introducing a z-value in mapping. Although the most commonly used third dimensional data in mapping is elevation, users may use various other attributes to depict the third dimension. Thus, 3D maps not only represents the location of a feature, but also either the height of the feature for elevation data, or other characteristics like population density of cities, crime counts, depth of underwater bathymetry.
Here are examples of 3 different types of 3D maps using three different dimensions, viz. elevation, bathymetry and population density.
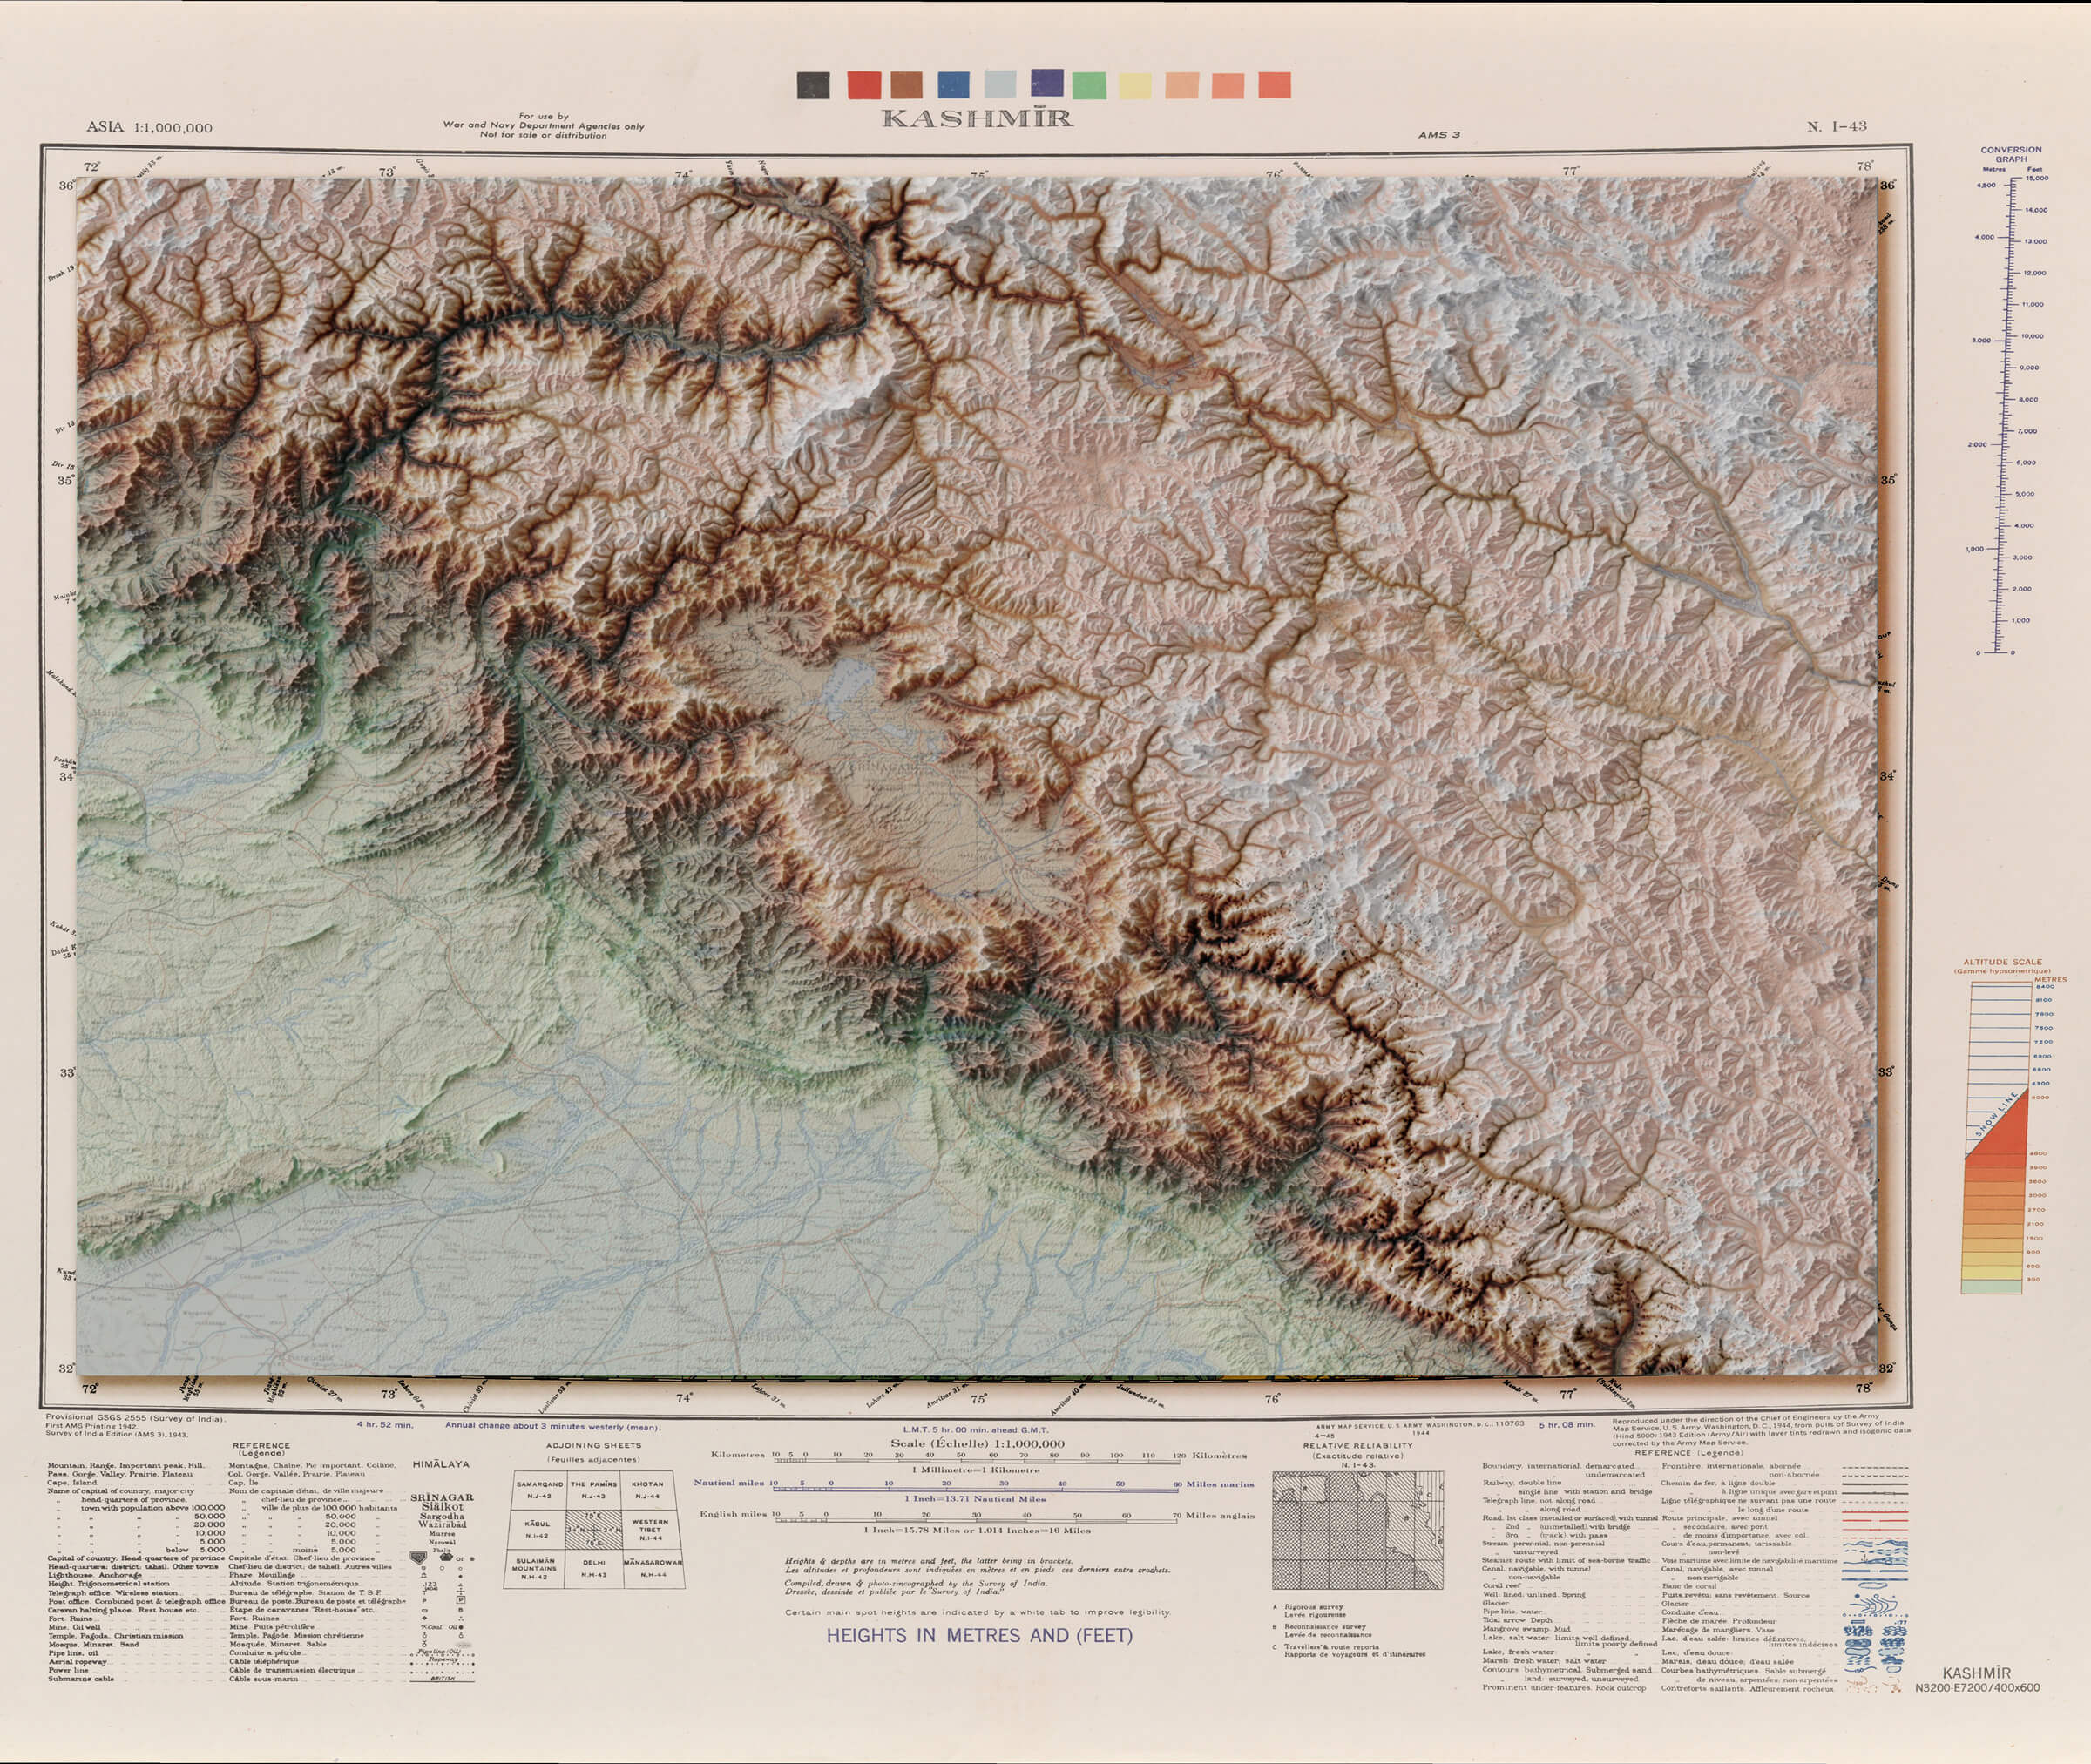
Topographic Map
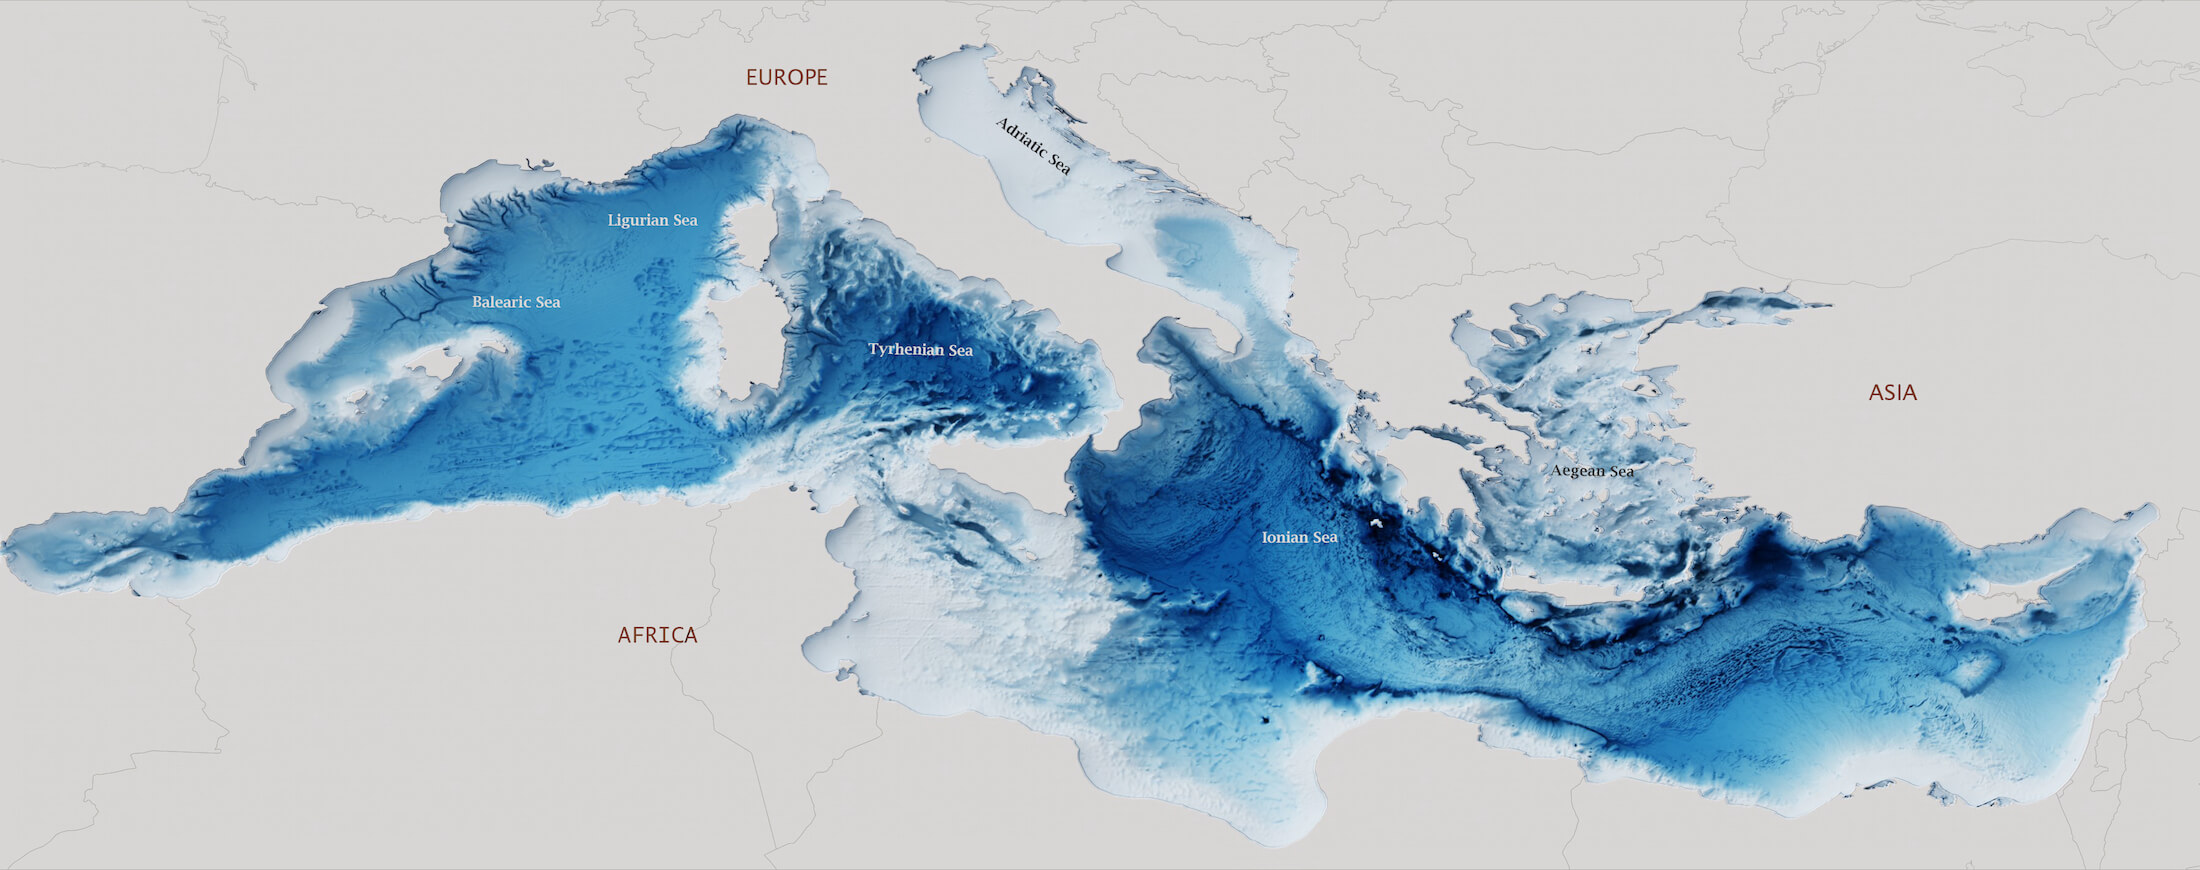
Bathymetric chart
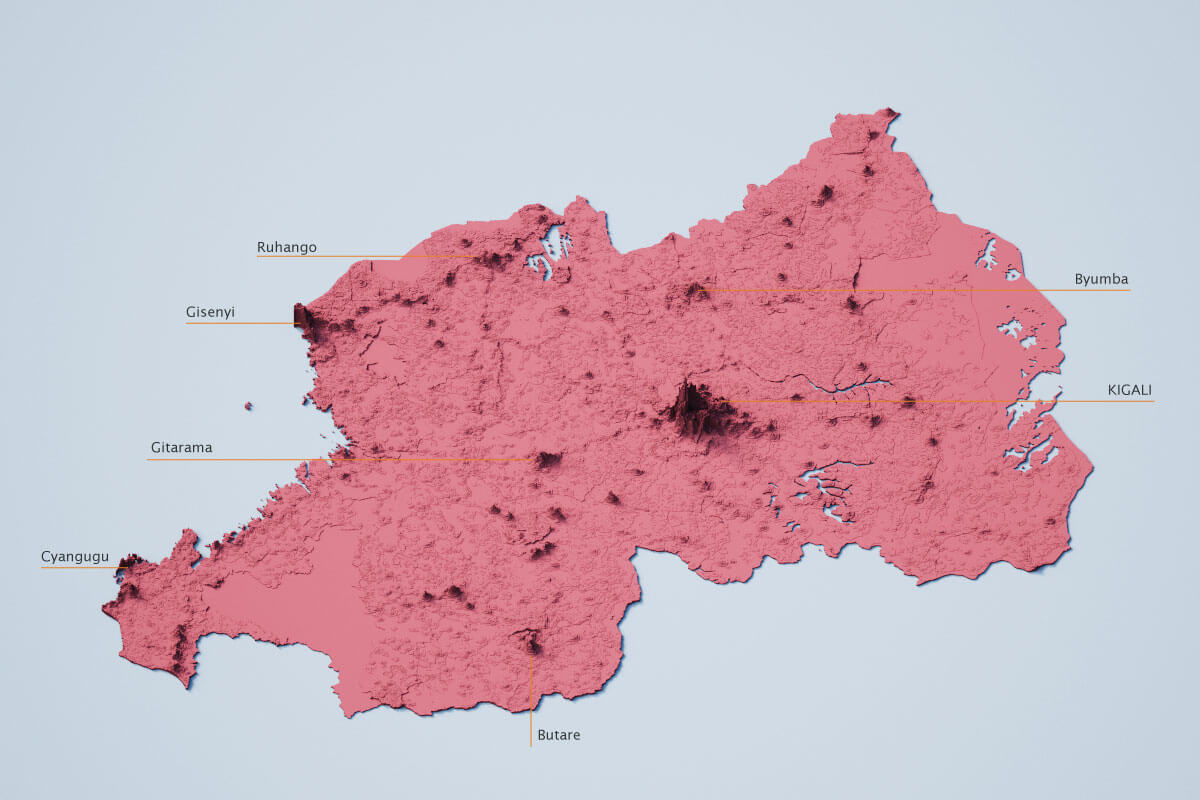
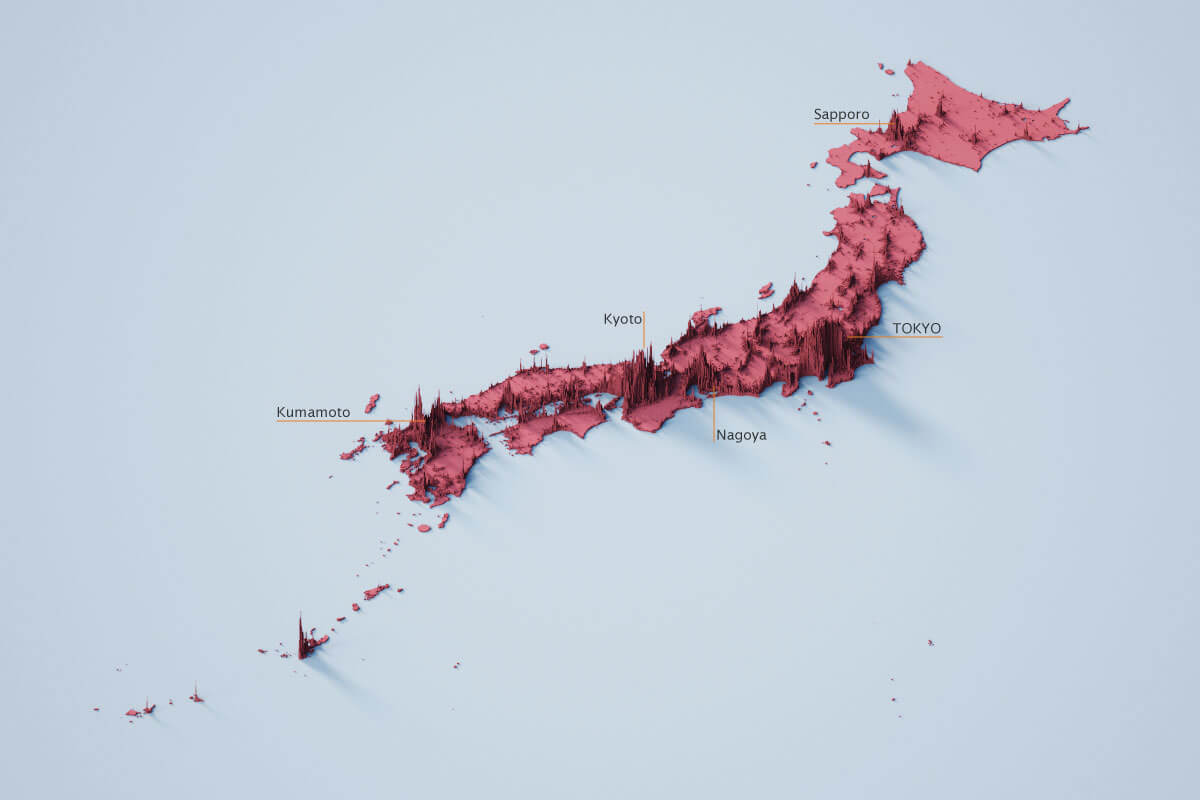
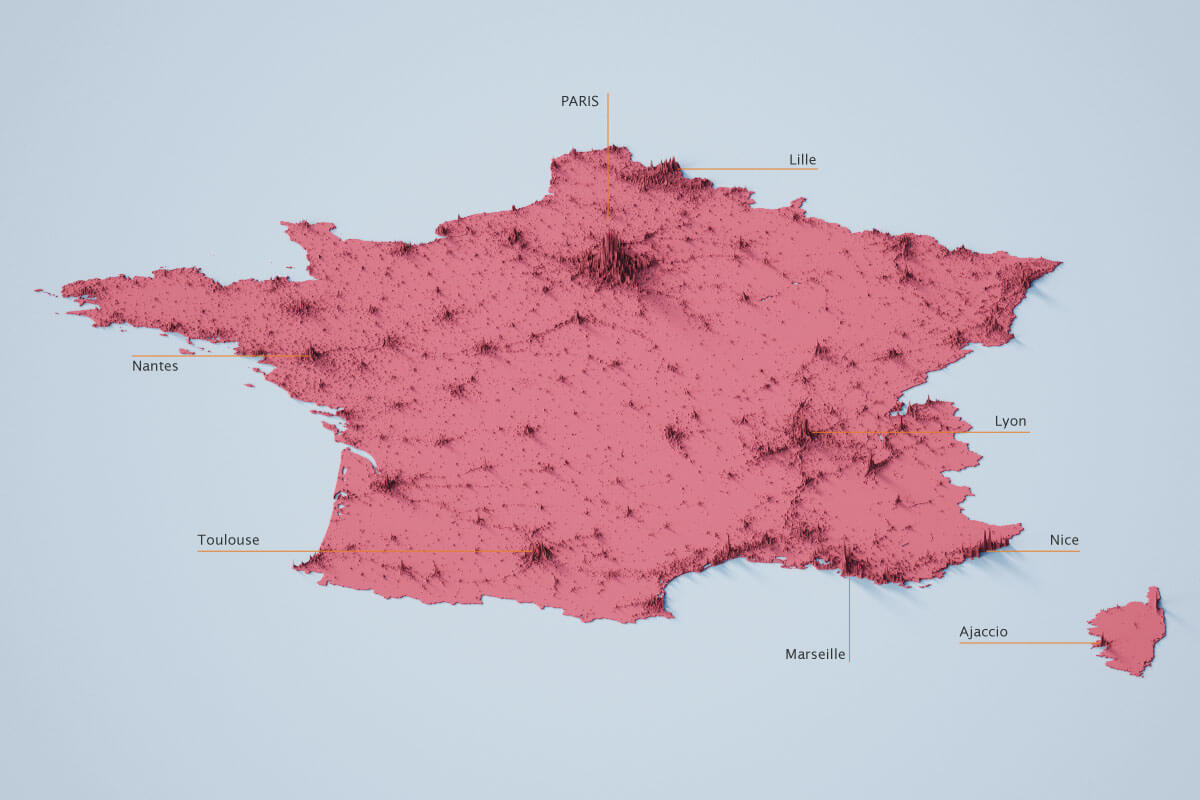
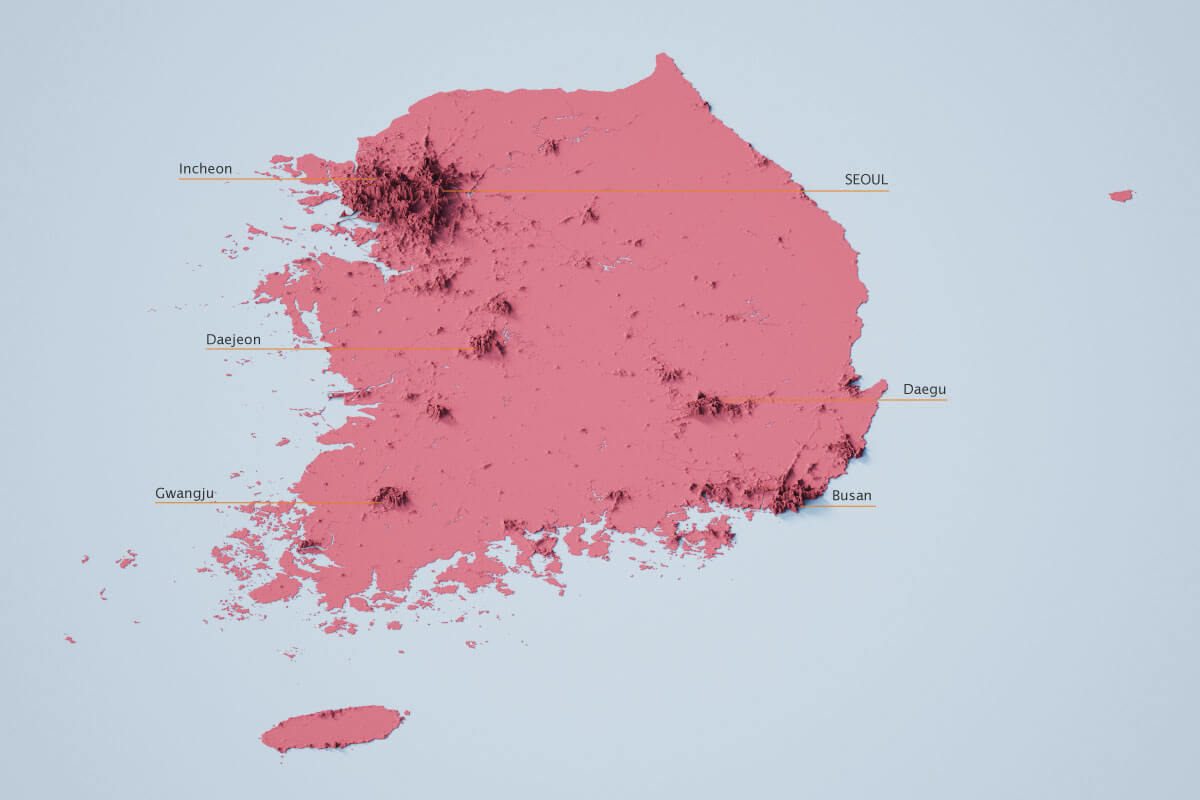
Population Density Map
Japan
France
South Korea
Rwanda