World CO2 emission vs GDP
Carbon Dioxide (CO2) is one of the primary greenhouse gas, emitted through human activity. The amount of CO2 emission has been rapidly increasing since the industrial revolution. Although the rate of increase in CO2 emission has reduced recently, this has been a major concern globally.
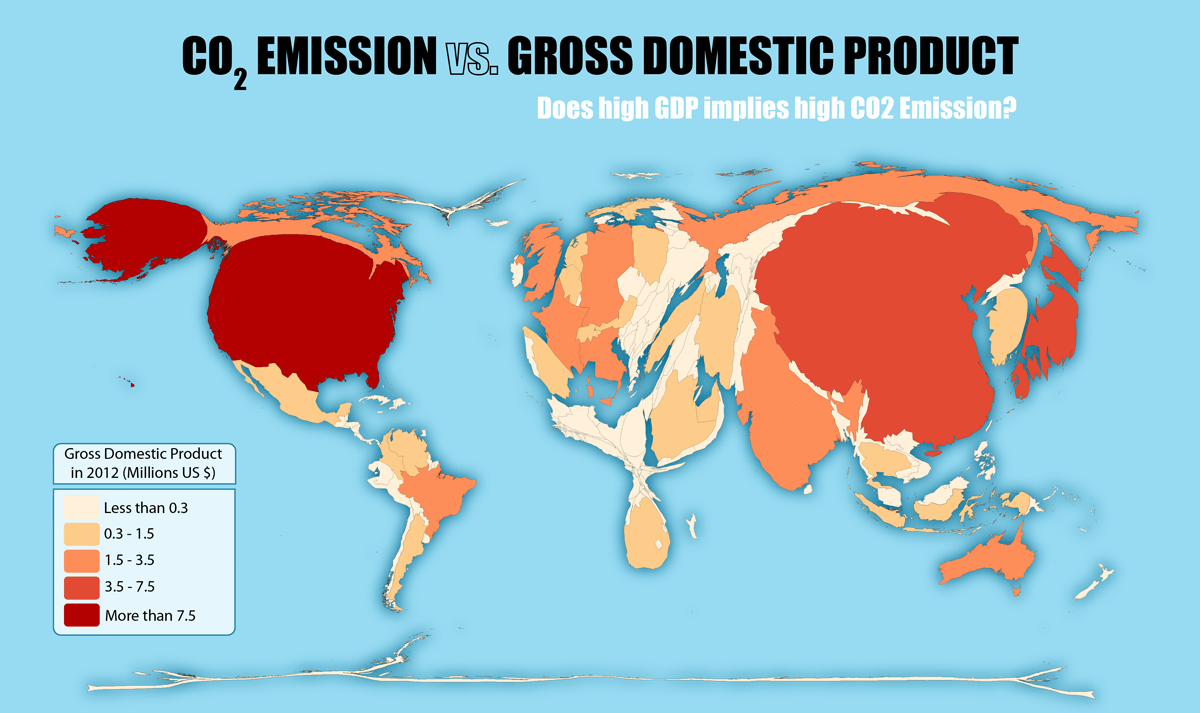
This is a bivariate map, representing the total amount of CO2 emission in the form of cartogram (where land area is substituted by the mapping variable) and total GDP through choropleth. This map clearly shows a positive correlation between the 2 variables, i.e., higher the GDP, higher is CO2 emission.
Data source: United Nations


